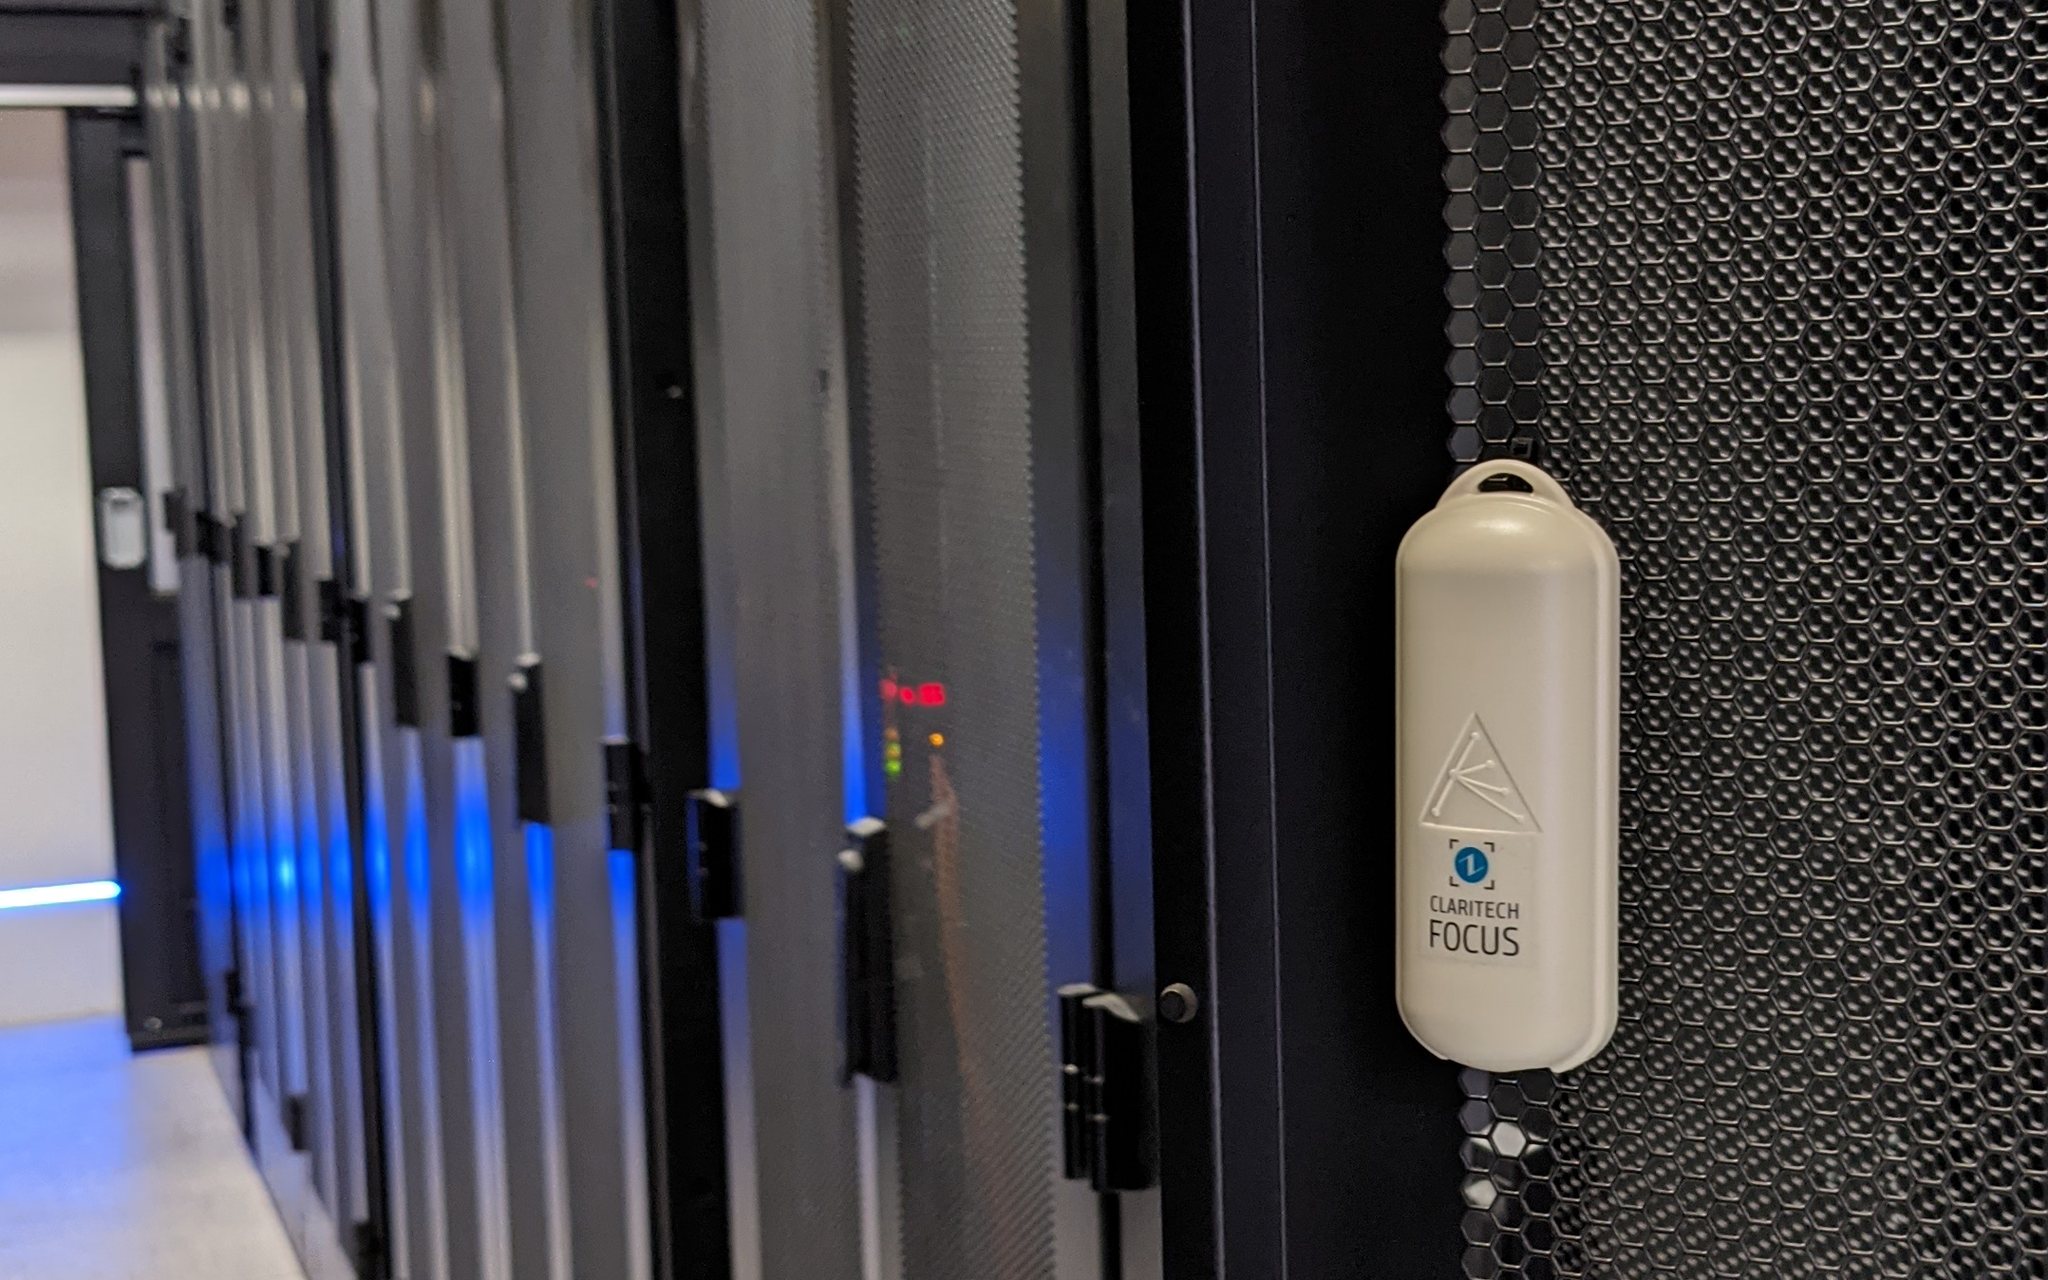
A single platform for any equipment. Claritech FOCUS turns the fragmented telemetry of your critical infrastructure - from data centers to telecommunications sites - into unified, actionable information, in real time.
FOCUS is our own vendor-agnostic DCIM platform that collects and standardizes power, cooling, security and environmental data from equipment of any type, brand, model or age - without replacing your existing hardware or software. Built on open-source technologies proven by hyperscalers, it eliminates data silos across your entire network and delivers real-time visibility, energy optimization and AI-ready analytics.
It provides operational support to data-center managers, network operators and engineers, technology executives, IT teams, and energy and technical-facilities departments.
One platform for data centers and telecom
Data centers and technical rooms
Rack-level and room-level monitoring, automatic PUE / DCiE calculation, efficiency supervision for cooling and ventilation systems and capacity management for backup systems, power distribution and rack and room loads, plus integration of access control, detection and video surveillance systems. From technical rooms to regionally distributed data-center systems with over 30,000 telemetry data points per minute, correlated in a single interface. For data-center operators, banking and financial institutions, retail networks and public IT infrastructure.
Telecommunications networks
Telemetry data normalization and visibility for telecommunications sites, fixed and mobile locations, network nodes and switching centers: 25–100 standardized variables per site. The solution delivers energy-consumption optimization, fuel-theft prevention, supervision of battery backup systems and generators, tenant sub-metering, integration of access control, surveillance and detection systems, and SLA tracking. For telecommunications operators, public and private networks, service providers and towercos.

Why Claritech FOCUS
Standardized data
We convert, align and standardize data from your equipment’s disparate protocols and interfaces into unified formats, per equipment class - a single “language” and normalized parameters for the entire infrastructure.
We integrate existing equipment
Works with every brand, model and generation of existing equipment: sensors, meters, UPS systems, HVAC, PDUs, generators, detection panels, IP cameras. Fast, complete deployment across thousands of sites.
Eliminates data silos
We unify existing gateways, BMS/DCIM software, IoT devices and networks into a single platform - and bring abandoned monitoring systems back into service, delivering complete real-time visibility in a single source of data.
Scalable, resilient architecture
We deploy an open-source stack proven by hyperscalers: virtualization, container orchestration, data streaming, time-series databases and Grafana dashboards.
AI-ready
We deliver an open architecture compatible with AI/ML applications - clean, structured data, ready for analysis and prediction, ready to be consumed through a Northbound API.
You own the data
The infrastructure and the resulting data belong to you - no single-vendor lock-in. Base future decisions on a complete, detailed history.
What we monitor
Power and energy
AC systems and smart meters, rectifiers and DC plants, VRLA and Li-Ion batteries, diesel generators, rack-level PDUs, UPS units, ATS / automatic transfer devices.
Cooling and environment
HVAC / CRAC units and chillers, airflow management, pressure, flow, temperature and humidity sensors, solenoid valves, liquid/flood detection panels.
Security and auxiliaries
Access control, perimeter monitoring systems, IP camera integration, fire detection and suppression, intrusion alarms, fuel-level monitoring, environmental sensors.
Benefits
Higher availability
Fast interventions through automated anomaly detection and failure root-cause analysis - incidents can be resolved before they become outages.
Optimized maintenance
Interventions scheduled on equipment history and actual condition. Extended infrastructure lifespan.
Data-backed decisions
A digital model with real-time data and historical trends, to understand the mechanisms that drive business performance.
Energy efficiency and SLAs
PUE/DCiE calculation, consumption metering, cooling optimization and continuous SLA-compliance tracking - for lower energy costs and emissions.
Features and control
The same standardized data serves multiple purposes and multiple audiences - from operations to management.
Performance
Real-time measurements and KPI calculation, automated diagnostics and configurable alerts.
Energy
Metering, trends and optimization, plus a billing application dedicated to data centers.
HVAC and environment
Integration and control of heating, cooling and ventilation systems; temperature, humidity and air quality.
Access control and surveillance
Access control, IP camera integration, operational event correlation, BMS integration.
Control and automation
Closed control loop: generator start/stop, HVAC setpoint adjustment, power-source switching, automations.
Advanced strategies
Extended backup runtime, optimized hybrid PV-battery-generator operation, Li-Ion battery management, predictive maintenance.
Architecture and integration
Modern technology stack
An Apache Kafka-compatible message bus for real-time telemetry from thousands of sites, time-series databases with configurable retention and Kubernetes orchestration - on-premises, in the cloud or hybrid, with horizontal scaling and automatic failover.
Visualization and access
Grafana dashboards with 2D/3D floor plans, site maps, hierarchical views and mobile support (iOS/Android). Customized Grafana panels. Secure local and remote access through the browser, based on roles and permissions.
Protocols and interfaces
SNMP v1/v2c/v3, Modbus TCP and RTU, MQTT, HTTP(S) REST API, ICMP, SMTP. Dry-contact (NO/NC) and analog inputs, RS-232, RS-485, 1-Wire, CANBus, Ethernet.
Edge gateways
Industrial devices for local data conversion and aggregation (Modbus, SNMP, MQTT broker, scripting, VPN), extended temperature range -40°C to +80°C, DIN-rail or 19” rack mounting.
Dashboards and analytics
Site level
AC/DC consumption, battery status, generator autonomy, environmental conditions, security events, alarms and equipment status.
Network level
Site rankings by efficiency, power histograms, geographic maps with alarms, aggregated tables and benchmark-deviation tracking.
Advanced analytics
PUE/DCiE calculation, billing data integration, GHG emissions reporting, supplier comparisons, capacity forecasts and predictive maintenance.
Results
Over 2,000 telecom sites and over 100 data-center locations monitored, in 8 countries, with thousands of devices integrated and over 30,000 telemetry data points per minute in a single data center - without replacing existing equipment.



Case study: a new data center, fully integrated
A telecommunications operator, part of a multinational group operating in almost 50 countries, opened a new data center - physically and functionally separate pods, redundant power, in-row cooling. Every subsystem reported its data into its own interface. FOCUS integrated all of them into a single dashboard, with 2D and 3D floor plans, without replacing any equipment: SNMP, Modbus and LoRa telemetry over what was already on site.
The result: automatic PUE calculation, correlated with data-center and outdoor temperatures, alarm correlation to find the root cause, and maintenance scheduled on actual running hours - estimated to cut the associated costs by up to 25%.
Case study: backup batteries, monitored block by block
Batteries are the final stage of a critical site’s power chain, and their degradation cannot be assessed without block-level measurements. For a client with critical power, we integrated into FOCUS a Phoenix Broadband system with 121 sensors: every 12 V block reports its voltage, internal admittance and temperature, and every string its charge and discharge current. A block’s aging shows up in the data before it becomes an incident, and replacements are planned precisely - only the worn blocks, not the whole string on a calendar.
Case study: mobile data centers, in containers
Three identical modules - each with one power container and three IT containers - for a communications operator with a national network. FOCUS integrated all 195 devices across the 12 containers, from UPS units, generators and chillers to every rack’s PDUs, with synoptic plans per container and template dashboards that serve all modules through a simple menu selection.
FOCUS for distributed site networks
The same platform also covers geographically spread infrastructure - not just a single equipment room. Over 120 remote-monitoring projects delivered for clients with a national footprint.
Telecom
Telecommunications sites at network scale: from dozens to thousands of locations in the same platform, with 25–100 standardized variables per site and SLA tracking across the entire network.
Banking and retail
Branches, agencies and store networks: power supply, UPS units, air conditioning, security and environment - hundreds of locations in a single view, with threshold-based alerting.
Technical rooms and shelters
From a single cabinet or enclosure to technical rooms and shelters: UPS status, mains power, temperature and access - wherever no one is permanently on site.
Case study: over 400 telecom sites, in a national program
The monitoring program of a telecommunications operator: over 400 critical sites equipped in yearly phases with complete power, fuel and generator monitoring, one-time SMS-code access control and IP cameras - around 60 parameters per site, with SNMP integration into the operator’s systems, uninterrupted since 2010.
Claritech FOCUS Billing - energy billing
An extension of the platform: the energy data FOCUS standardizes feeds the billing process. FOCUS Billing is our cloud-native energy-billing application for data-center operators, towercos and mobile networks - from dozens of sites to over 10,000 telemetry points. It eliminates spreadsheets and manual intervention, produces traceable, audit-ready bills, and integrates directly with ERP systems.
No-code tariff engine
A visual Tariff Builder: time-of-use rates, consumption thresholds, taxes and multi-currency. Every formula is versioned - any past bill can be reproduced exactly.
Complete, auditable data
Collection straight from meters, APIs, time-series databases and files; validation, gap-filling and a quality flag on every value - with an audit trail from reading to invoice.
Scheduled billing, ERP-integrated
Drag-and-drop reports delivered as PDF, Excel, XML or via API; scheduled billing runs with approval workflows and secure export to financial systems.
Cloud-native scale and security
Microservices on Kubernetes with Kafka streaming - 10,000+ telemetry points - plus role-based access control, encryption and immutable audit logs for compliance.
Download the FOCUS Billing brochure (PDF)
Frequently asked questions about FOCUS
What is DCIM and how is FOCUS different?
DCIM (Data Center Infrastructure Management) means centralized monitoring and management of a data center’s physical infrastructure - power, cooling, space, security. Most DCIM platforms assume equipment from a particular ecosystem. FOCUS is vendor-agnostic: it connects to what you already have, regardless of brand or age.
Do we need to replace our existing equipment?
No. This is the core principle of the solution. FOCUS reads your existing equipment via SNMP, Modbus and telemetry over other protocols, regardless of manufacturer or generation. If a system was abandoned because it was no longer supported, we can usually bring it back into service.
How long does implementation take?
We start with a pilot on one zone of your infrastructure - typically 1-2 weeks until the first data is visible in the platform. Installation and integration are carried out on live sites, without shutting equipment down.
Where is the data hosted and who owns it?
The data is yours. The platform can be installed on-premises, in the cloud or in a hybrid setup, on your infrastructure or on one we provide. No single-vendor lock-in.
Can it calculate PUE automatically?
Yes. FOCUS meters consumption per circuit and automatically calculates PUE and DCiE, correlating them with data-center and outdoor temperatures - so you can separate what is down to the weather from what is down to operations.
Does it work for a single rack?
Yes. The system handles topologies from a single rack or cabinet to complex sites with multiple enclosures, technical rooms or shelters - and scales as you add equipment.
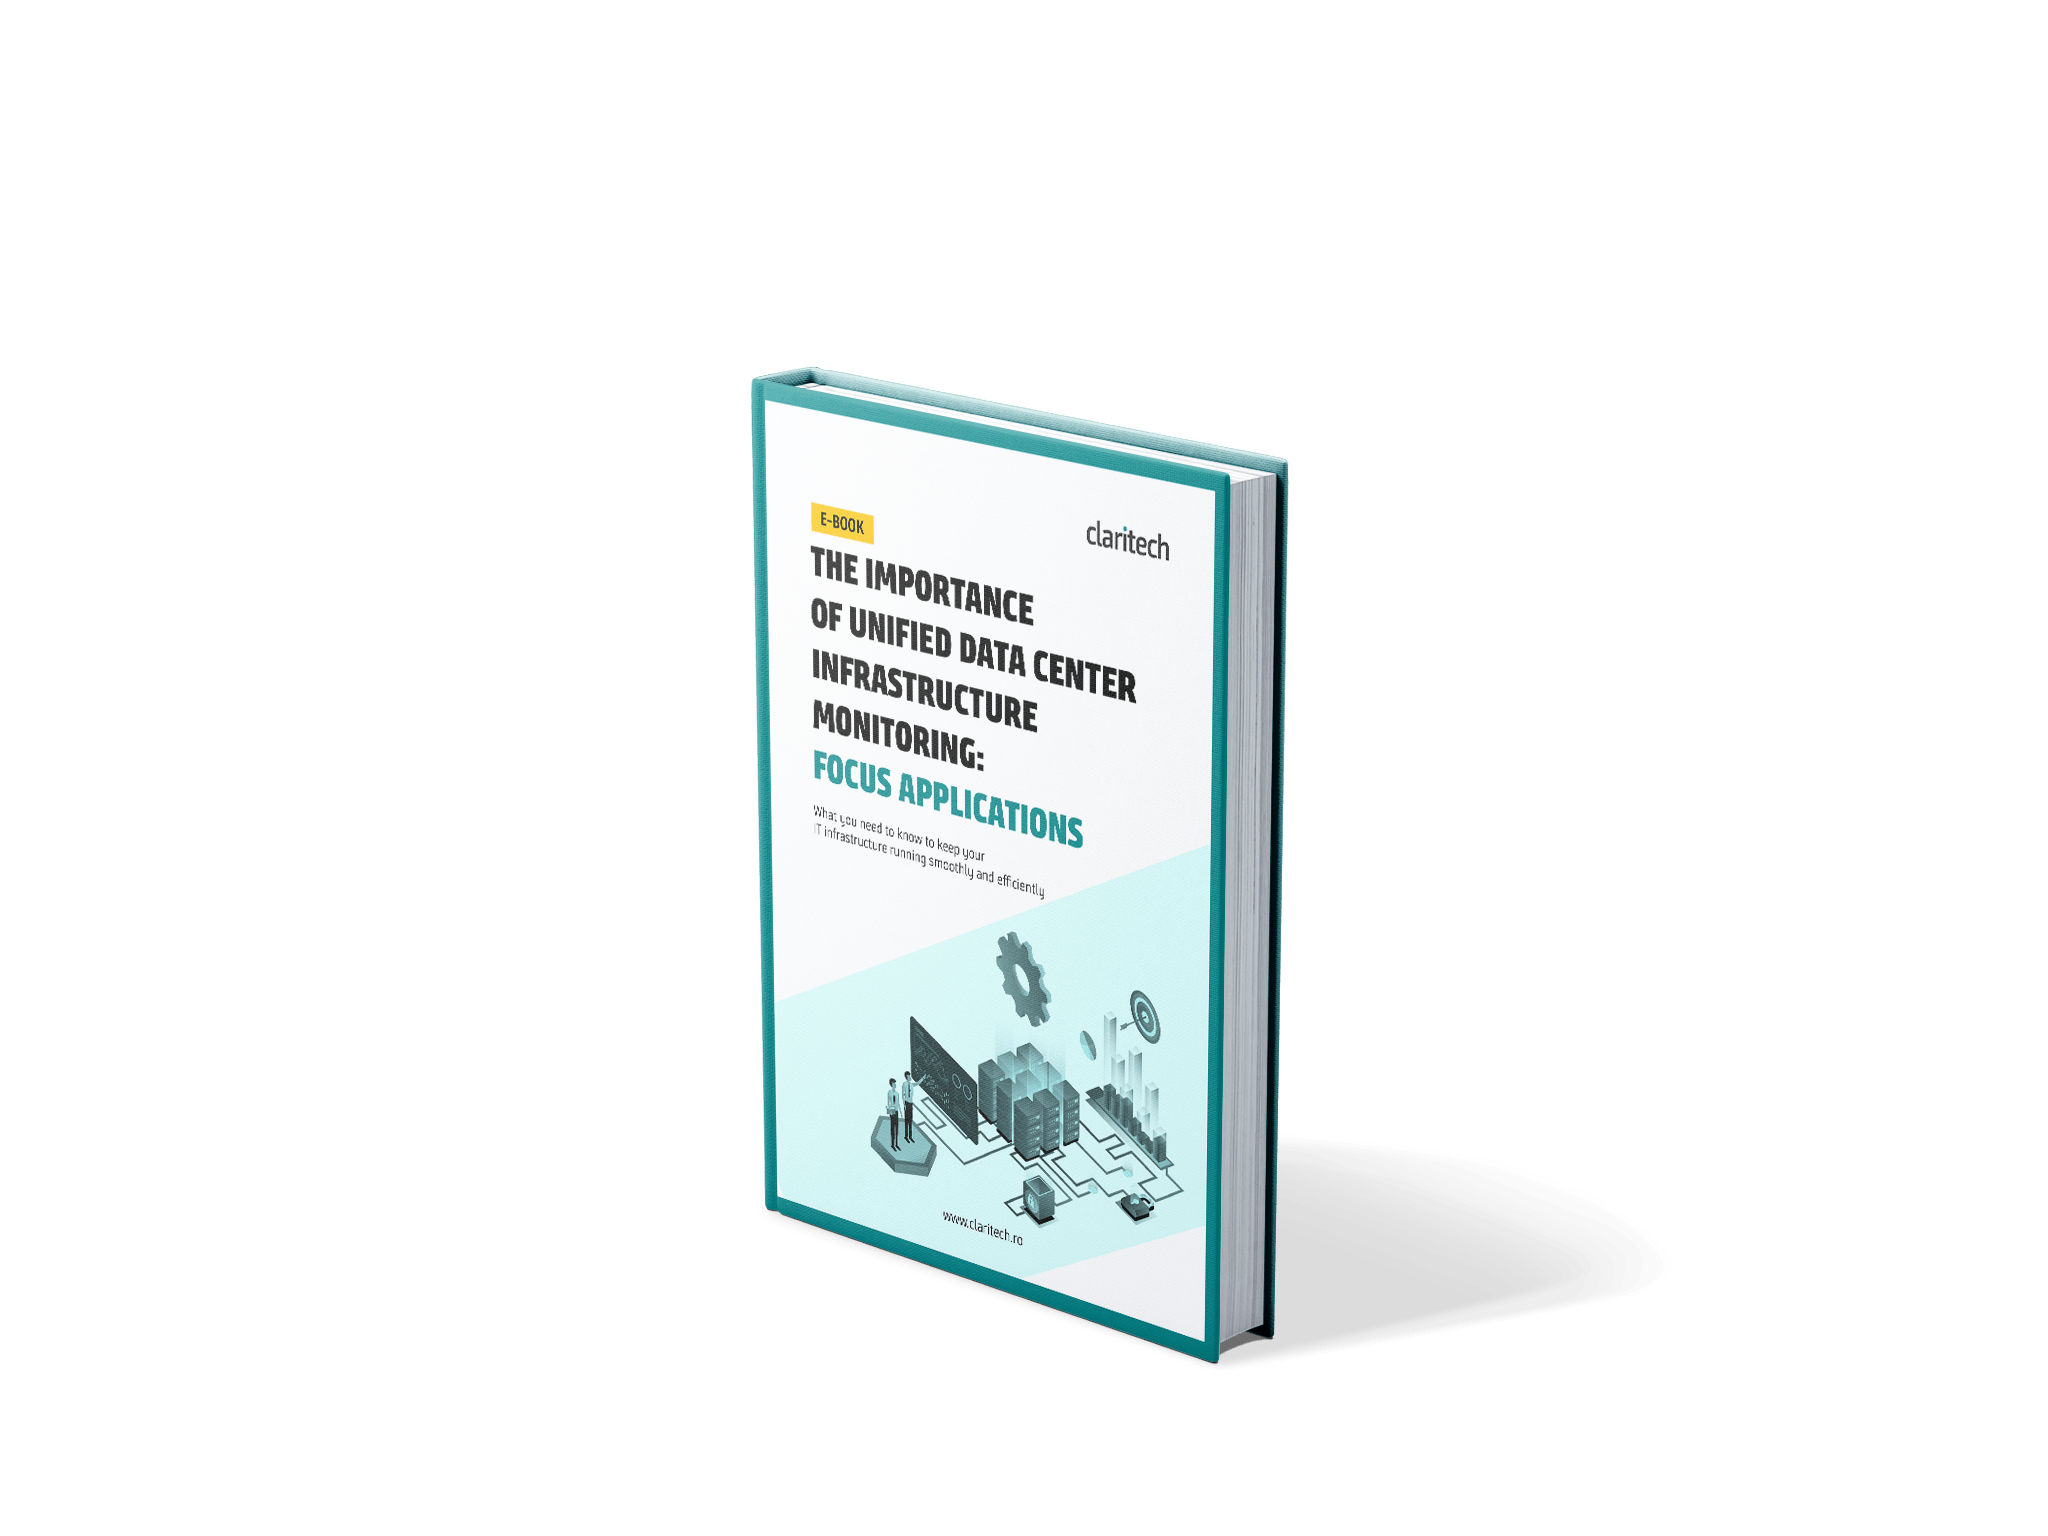
Download the FOCUS e-book
A complete guide to the benefits of centralized, real-time IT infrastructure monitoring - from the basics to a KPI list for running a data center and concrete ideas for improving energy efficiency with FOCUS.
Start with a pilot project
Every project starts with data visualization, without replacing existing equipment. A pilot on one zone of your infrastructure shows you, within weeks, exactly what you will see in the platform. Tell us what infrastructure you want to monitor and we will build the solution together.