About the project
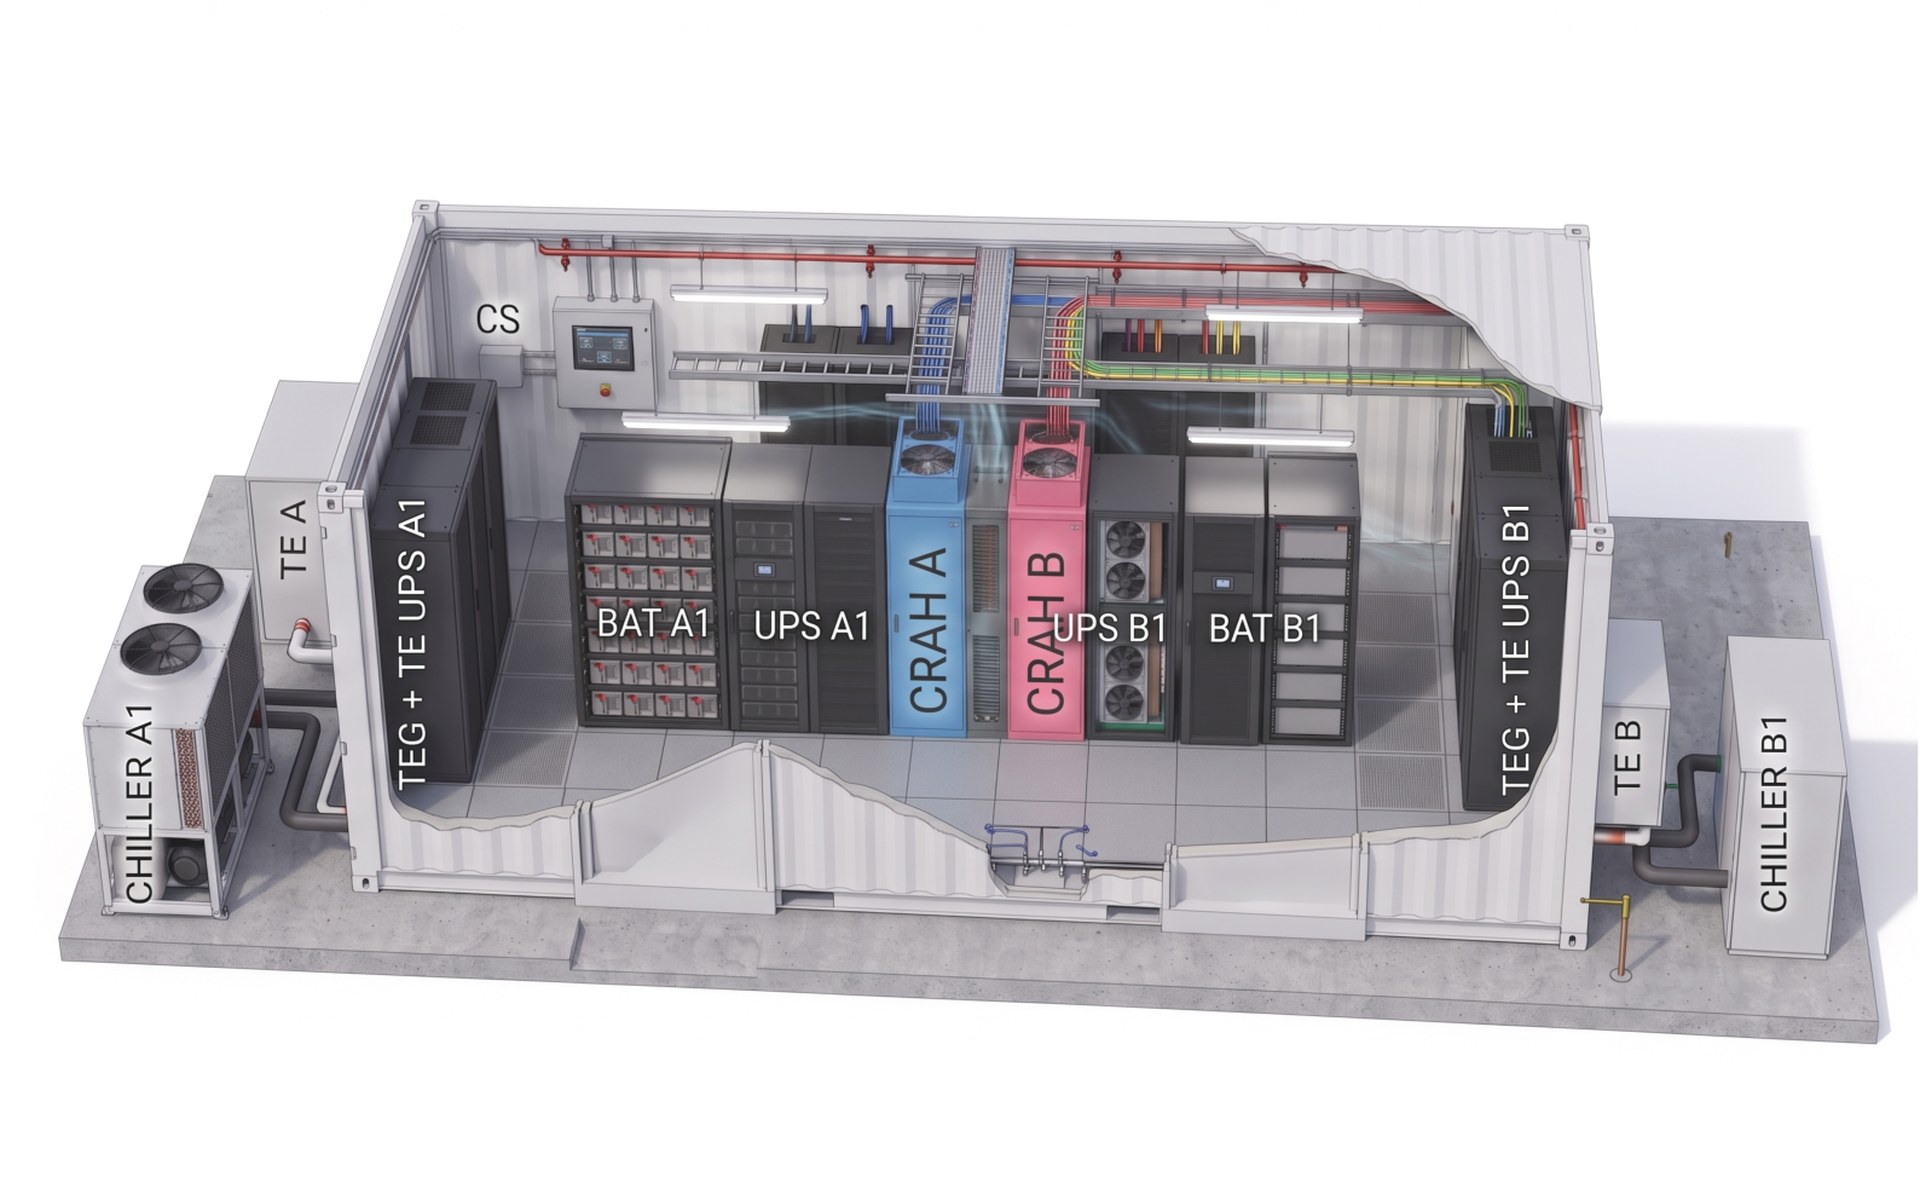
For a communications operator with a national network, we integrated into Claritech FOCUS three containerized mobile data centers, each made of one power container and three IT containers. In total, the project includes 12 containers with power, cooling, fire-detection, liquid-detection and access-control systems, centrally monitored in Claritech FOCUS.
Project requirements
Each module includes a power container with two UPS units and their battery banks, two chillers, two generators, the automatic transfer switches and two cooling units. Each IT container includes four racks fed on two separate paths, two cooling units and liquid detection. The 12 containers hold several types of equipment - UPS units, chillers, CRAH units, PDUs, power analyzers and detection panels - with different interfaces and protocols.
The project required integrating this equipment into a common interface, with a unified monitoring structure and the same conventions for thresholds and alarms.
The solution
We integrated all 195 devices of the three modules into Claritech FOCUS, over SNMP, Modbus and conversion gateways for the equipment without network interfaces. The data lands in a unified dashboard hierarchy: from each module’s overview, down to every container and every individual device.
Telemetry in numbers. Of the 195 devices, 159 are polled directly by the platform, every 60 seconds, over SNMP and Modbus TCP. Each cycle reads more than 3,600 parameters - voltages, currents, power and energy per phase, supply and return temperatures, fan speeds, and each unit’s states and alarms - for example, 16 parameters for a rack PDU and 49 for a CRAH unit. In total, over 5 million readings a day, roughly 1.9 billion data points a year, available for historical charts, alarm thresholds and incident analysis.
One module, four containers
The module dashboard shows the power container and the three IT containers at a glance: power, energy, the states of the chillers and CRAH units, fire and liquid alarms - on the A and B paths, separately.
Synoptic plans in real time
Each container’s floor plan is drawn in the dashboard, with every device represented in its real position and colored by state - from the UPS batteries to every rack.
Template dashboards per equipment type
Meters, UPS units, chillers, CRAH units, PDUs and generators each have a template dashboard; the same panel serves every device of that type, by simply selecting the module and the container.
Centralized thresholds and alarms
Monitored parameters have thresholds with severities (info, minor, major, critical), and violations generate notifications by email and API - with a full history for later incident analysis.
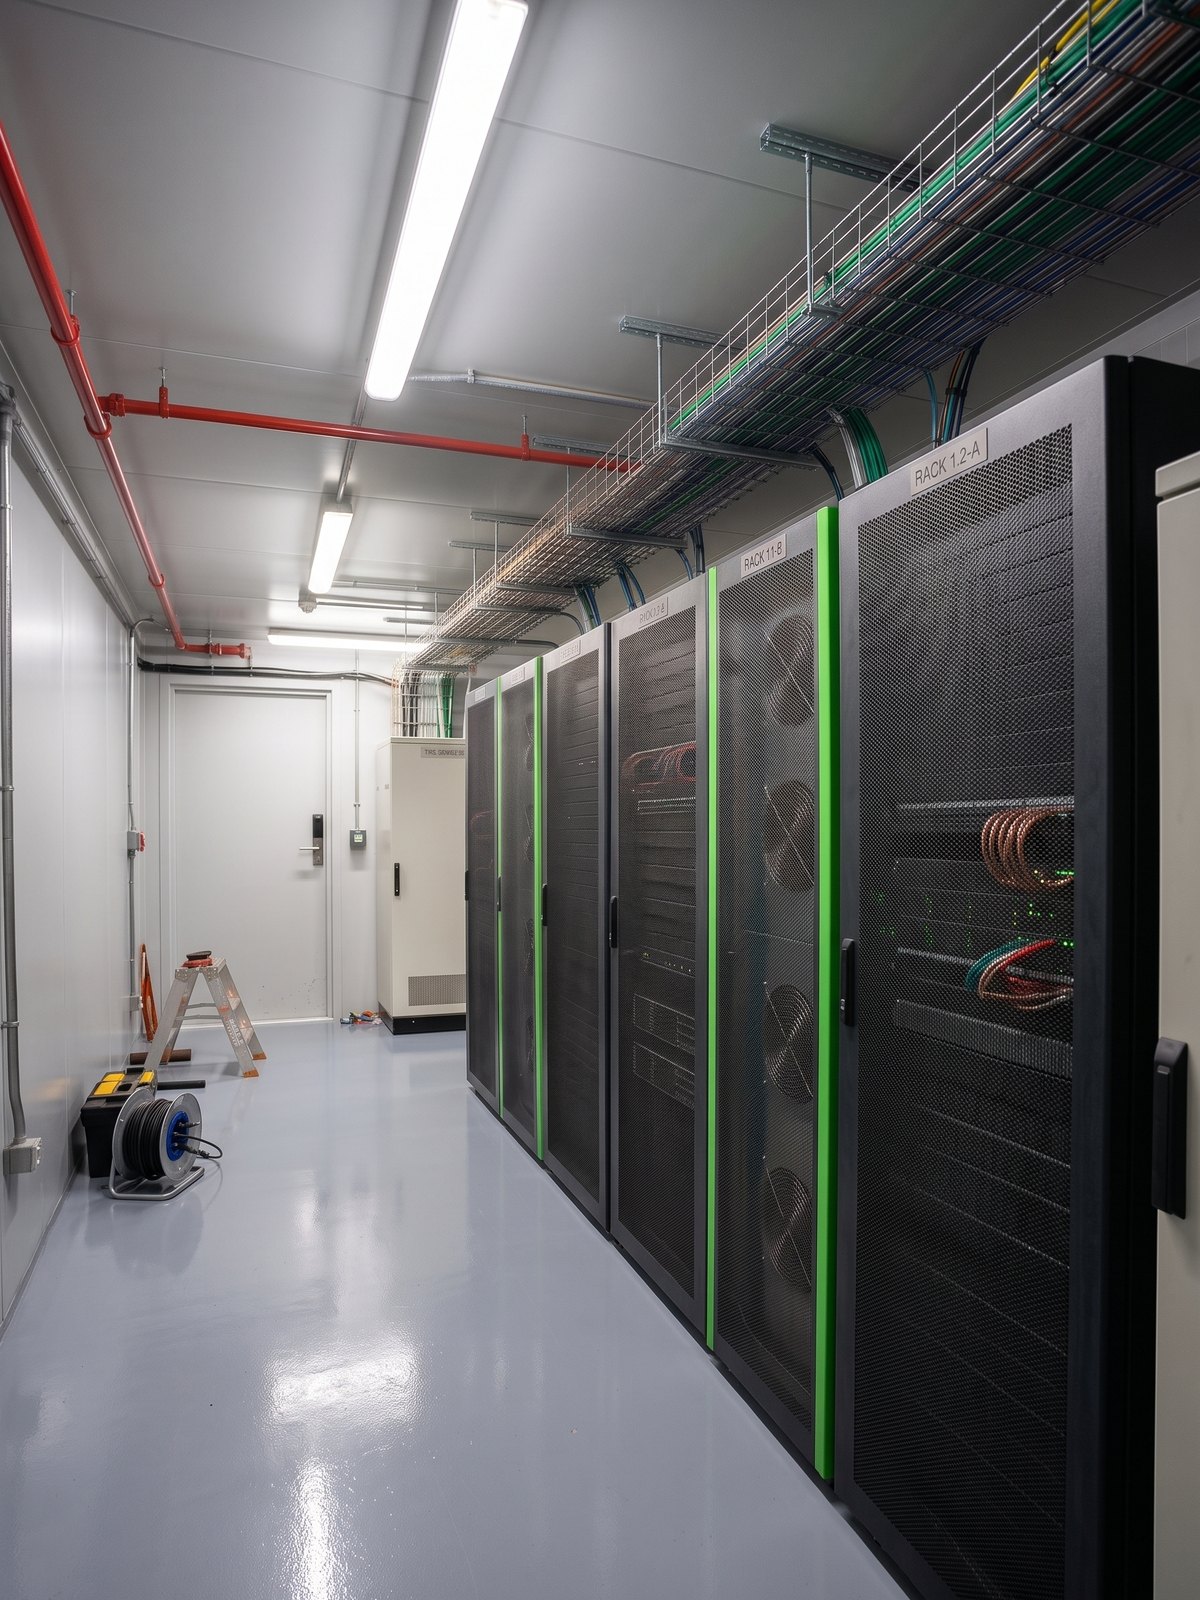
Inside an IT container: the racks, fed over two paths, and one of the cooling units, with the cable trays and technical routes overhead.
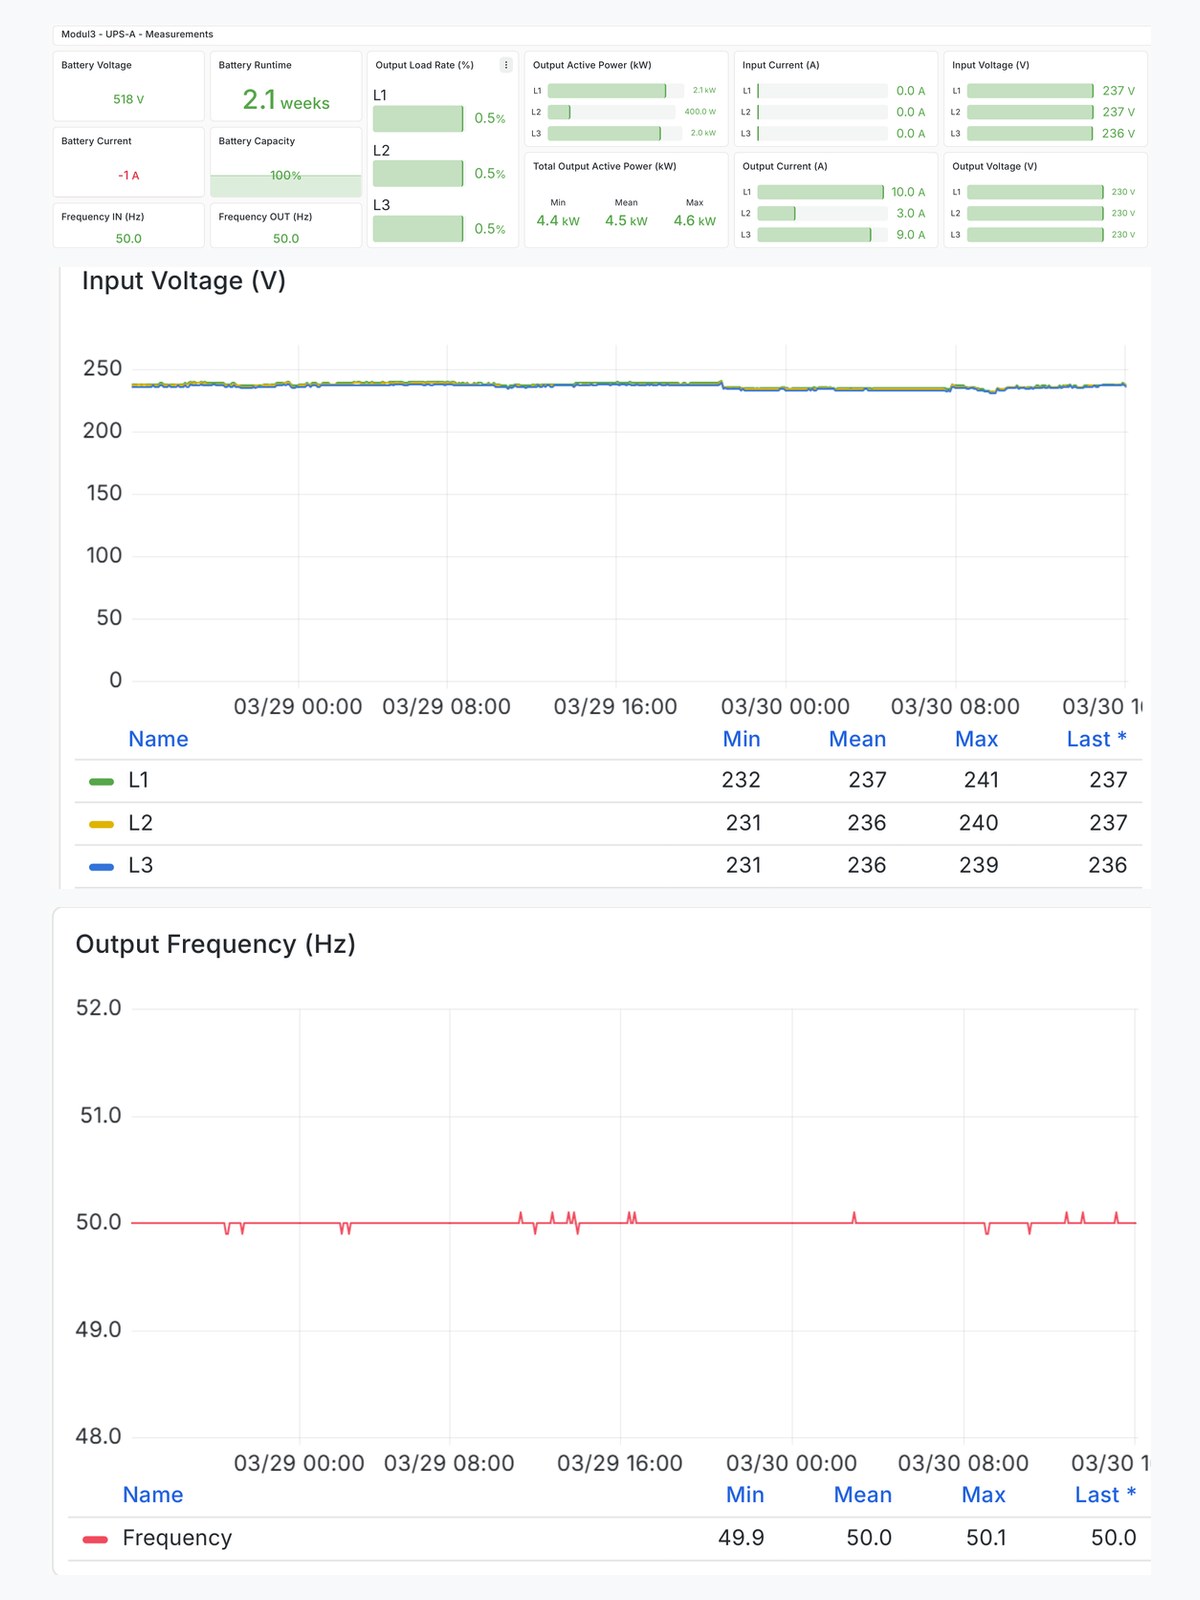
The UPS template dashboard: voltages, currents, frequency, runtime - the same panel serves all six UPS units, by selecting the module.
What we delivered
| Component | Details |
|---|---|
| Power integration | 6 UPS units with their battery banks, 6 generators, 6 ATS controllers and 30 power analyzers, on the A and B paths |
| Rack-level distribution | 72 smart PDUs - two per rack, on separate A and B paths, for each of the 36 racks |
| Cooling | 6 chillers and 24 CRAH units, with states, alarms and return-air temperatures per container |
| Fire and liquid detection | 3 detection-and-suppression panels and 12 liquid-detection panels, with their alarms brought into the same platform |
| Connectivity and conversion | 12 management switches and 18 conversion gateways for the equipment without network interfaces |
| FOCUS dashboards | Synoptic plans per container, template dashboards per equipment type, severity thresholds and email/API notifications |
The results
Centralized monitoring. The 12 containers are monitored from the same interface, including power, cooling, rack-level distribution and the detection systems. Thresholds and alarm conventions are applied uniformly.
Shared dashboards. The three modules have the same structure, so the same template dashboards are used for equipment of the same type. Selecting the module and the container applies the same panel to every UPS, chiller or PDU.
Module comparison. Using the same parameters and dashboards allows direct comparison of the modules and identification of differences in load, consumption or state between similar equipment.
Expansion. Additional modules with the same structure can reuse the existing dashboards and monitoring conventions, without rebuilding the structure from scratch.
Benefits for the operator
Monitoring the backup power supply. Each rack is fed over two paths, and the currents of the two PDUs are measured separately. Their sum shows at any moment whether a single path can take over the full load - the real condition of redundancy, validated by real data.
Integrated supervision of the power system. Grid voltages and frequency, UPS behavior and generator load take-up are recorded at one-minute intervals. A grid event can be analyzed in detail, and the periodic generator tests can be confirmed: the generator started, took load, and for how long.
Identifying signs of degradation. Rising CRAH fan speed at the same temperature difference, phase imbalance on a PDU or shrinking battery runtime are trends visible in the data before they become incidents. Maintenance can be planned on the actual condition of the equipment.
Energy measurement at every level. The meters at each module’s intake and on each IT container’s feed enable continuous energy-efficiency (PUE) calculation per module, the separation of losses along the power chain, and energy metering per rack, container and module. The power factor measured at the intake also shows the reactive energy the utility may bill.
Monitoring specific to the IT containers. In a sealed, high-density container, thermal inertia is measured in minutes: when the cooling system fails, the temperature rises quickly, and 60-second polling matters. For the same reason, every container has leak detection on the water routes, and the suppression panels are monitored for fault states as well. On a site without permanent staff, telemetry takes the place of routine on-site checks.
Why Claritech
The monitoring of this modular data center is part of Claritech FOCUS - the centralized monitoring platform, through which we monitor over 2,000 telecom sites and over 100 data-center locations, in 8 countries. The same platform covers classic rooms, mobile containers and entire networks of distributed sites.