Optimizing energy consumption starts with measurement. EFIC+ integrates everything that generates, stores and consumes energy in a site - into a single, real-time platform.
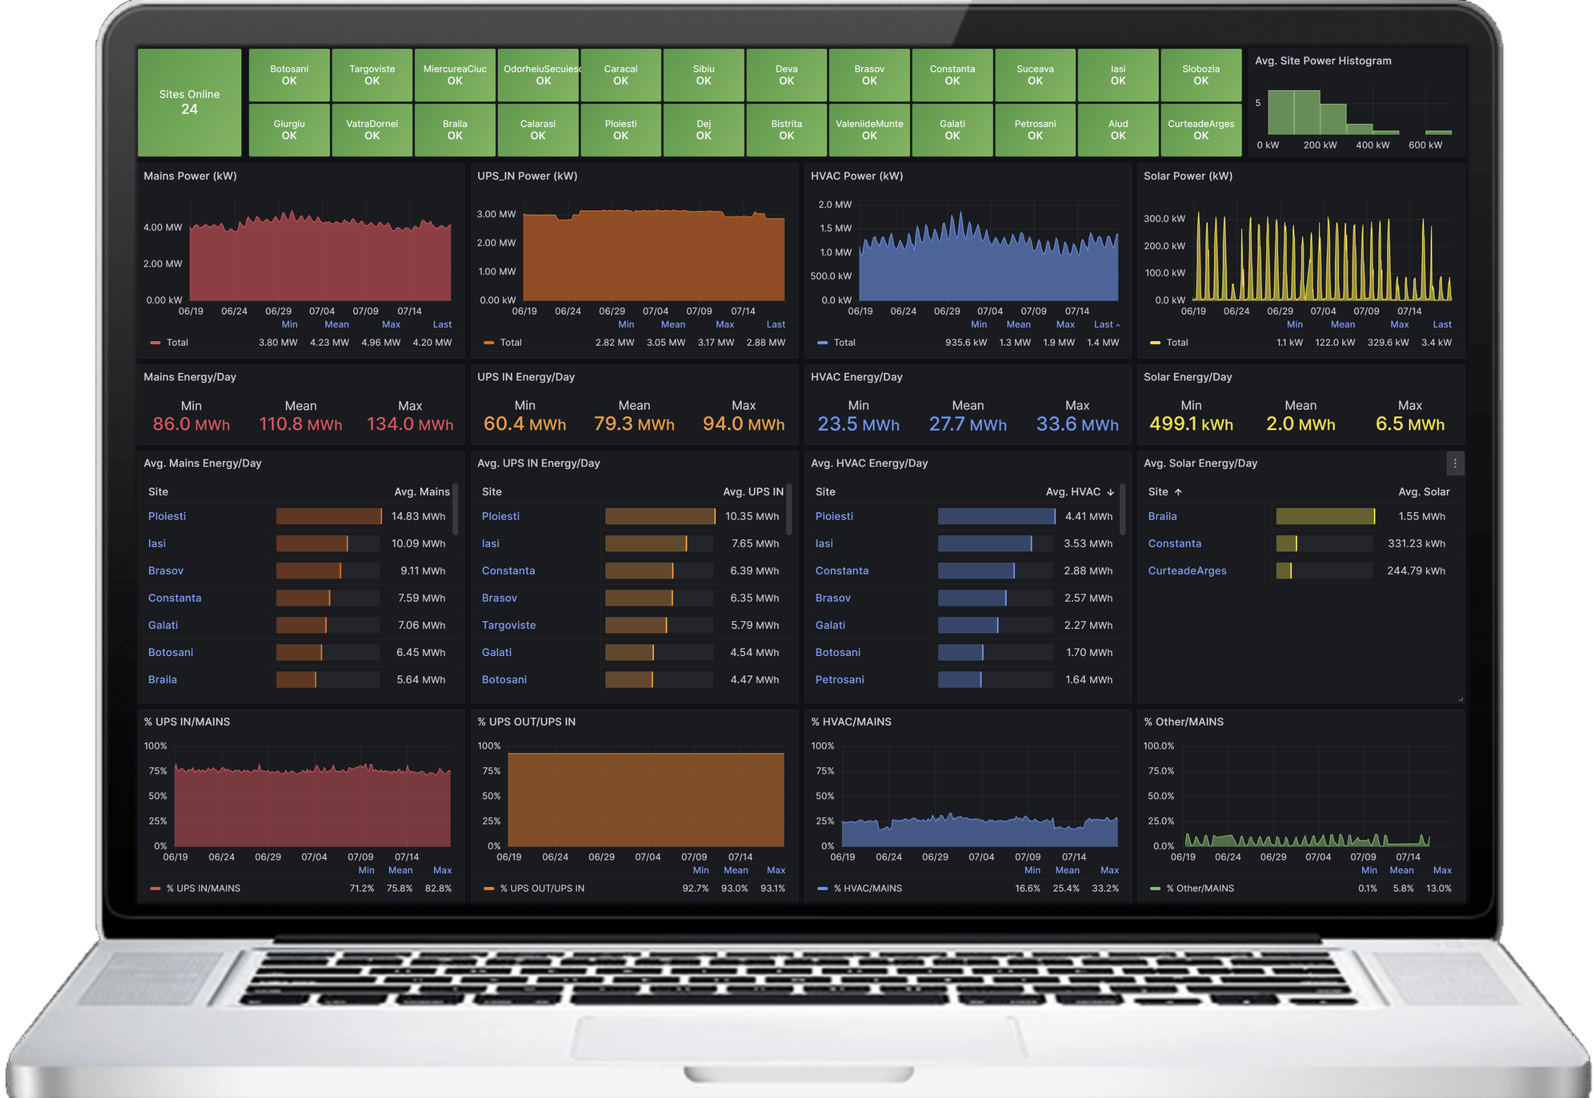
Most buildings already have the data needed to track energy efficiency: PV inverters, meters, chillers and other HVAC systems, the generator set. The problem is that each system runs in isolation, delivering data in its own interface, over its own protocol. EFIC+ brings them all into one place, on the same timeline, and turns them into indicators a manager can use.
Who the solution is built for
Building management
Showrooms, offices, commercial spaces: energy performance, thermal comfort and budget predictability.
Industry and logistics
Controlling energy spend, metering per production area, and identifying losses.
Local administrations
Centralizing consumption across tens or hundreds of sites and planning investments.
What we actually integrate
We do not stop at the main meter. We integrate every subsystem that generates or consumes energy, down to individual parameters - not just aggregate consumption.
Solar generation
Inverters (various brands and interfaces), per-inverter output, total production, self-consumption and energy exported to the grid.
Battery storage
State of charge (SoC) per battery bank, energy delivered from batteries, charge/discharge cycles.
Grid supply
Energy import and export per transformer, active, reactive and apparent power, frequency, power factor, phase loading and imbalance.
Per-circuit metering
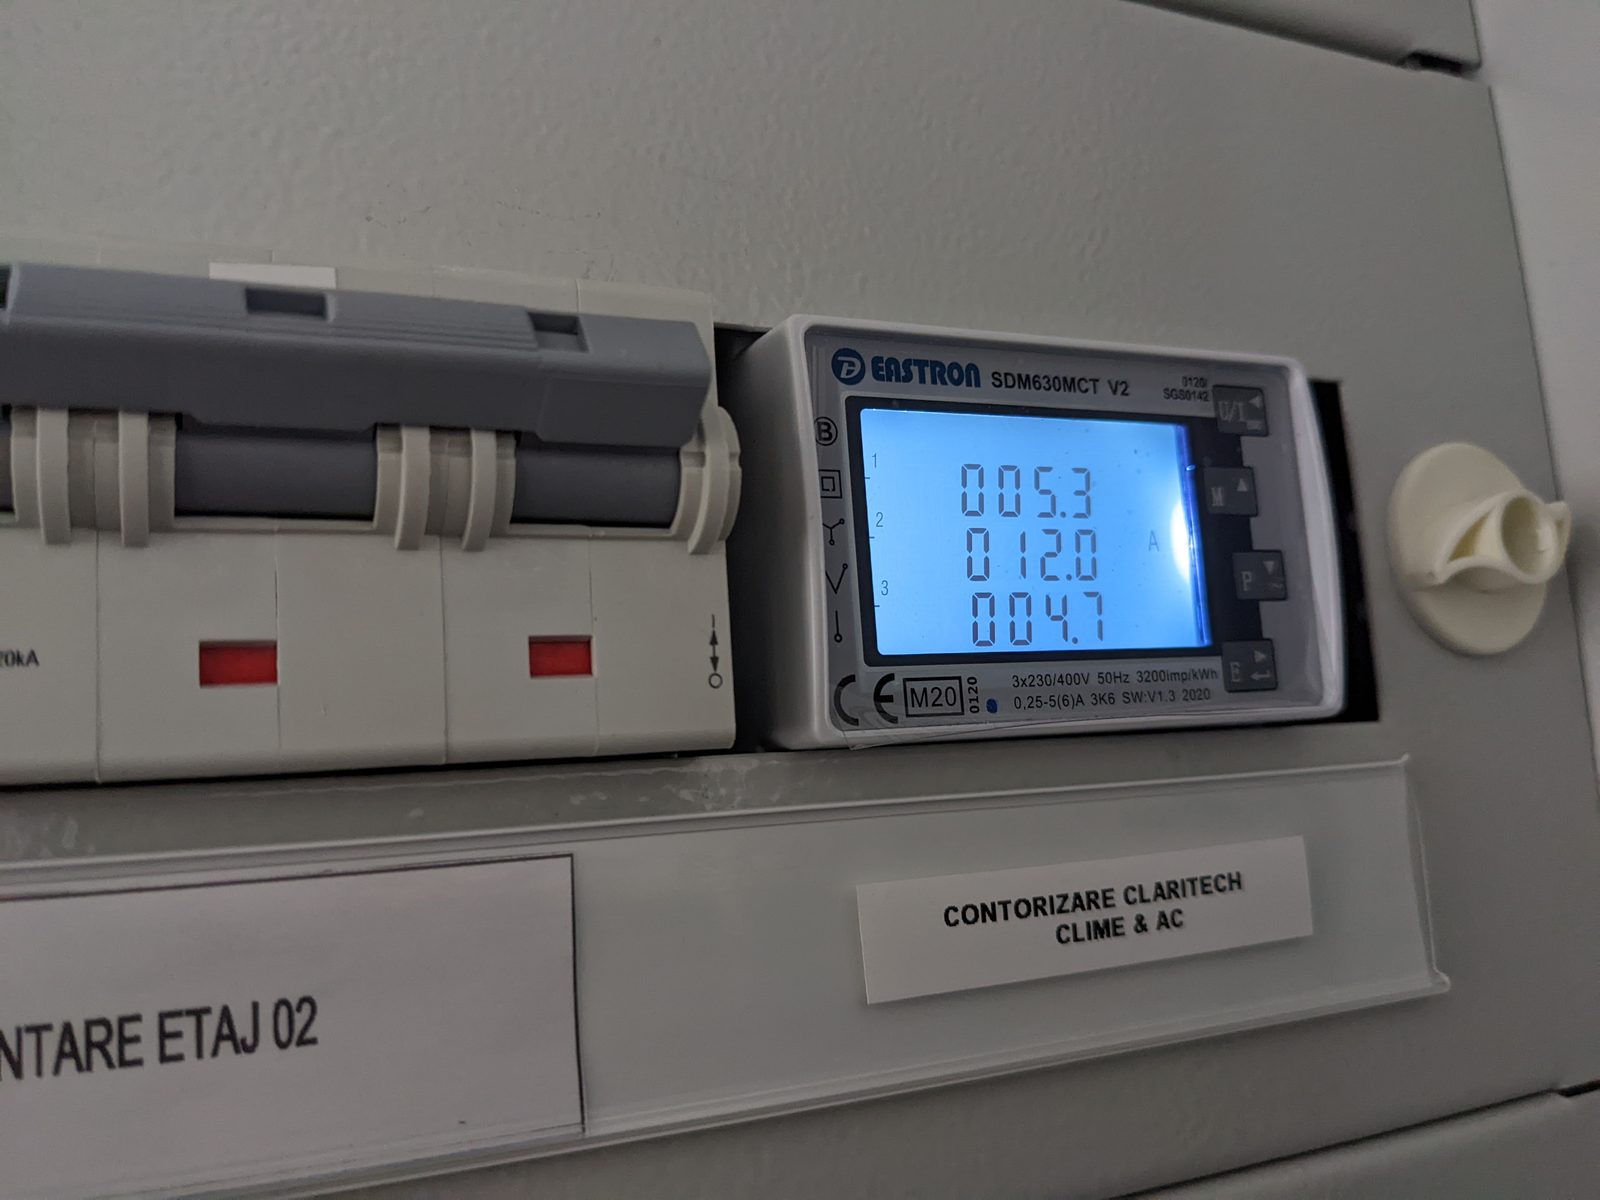
Separate measurement per zone and load type: showroom, offices, workshop, UPS, HVAC, chillers - not just a single building total.
Cooling and HVAC plant
Chillers and other HVAC systems: setpoint, operating mode, supply/return fluid temperatures, pressures, compressor status, fault codes, fan stage, pump status.
Generator sets
Status, voltages and currents on all 3 phases, active power, frequency, running hours, number of starts, fuel level, hourly consumption, coolant temperature, engine speed, oil pressure - plus remote control.
Environmental sensors
Temperature and humidity per zone, with an outdoor reference, to correlate HVAC consumption with real conditions.
Gas, EV and UPS
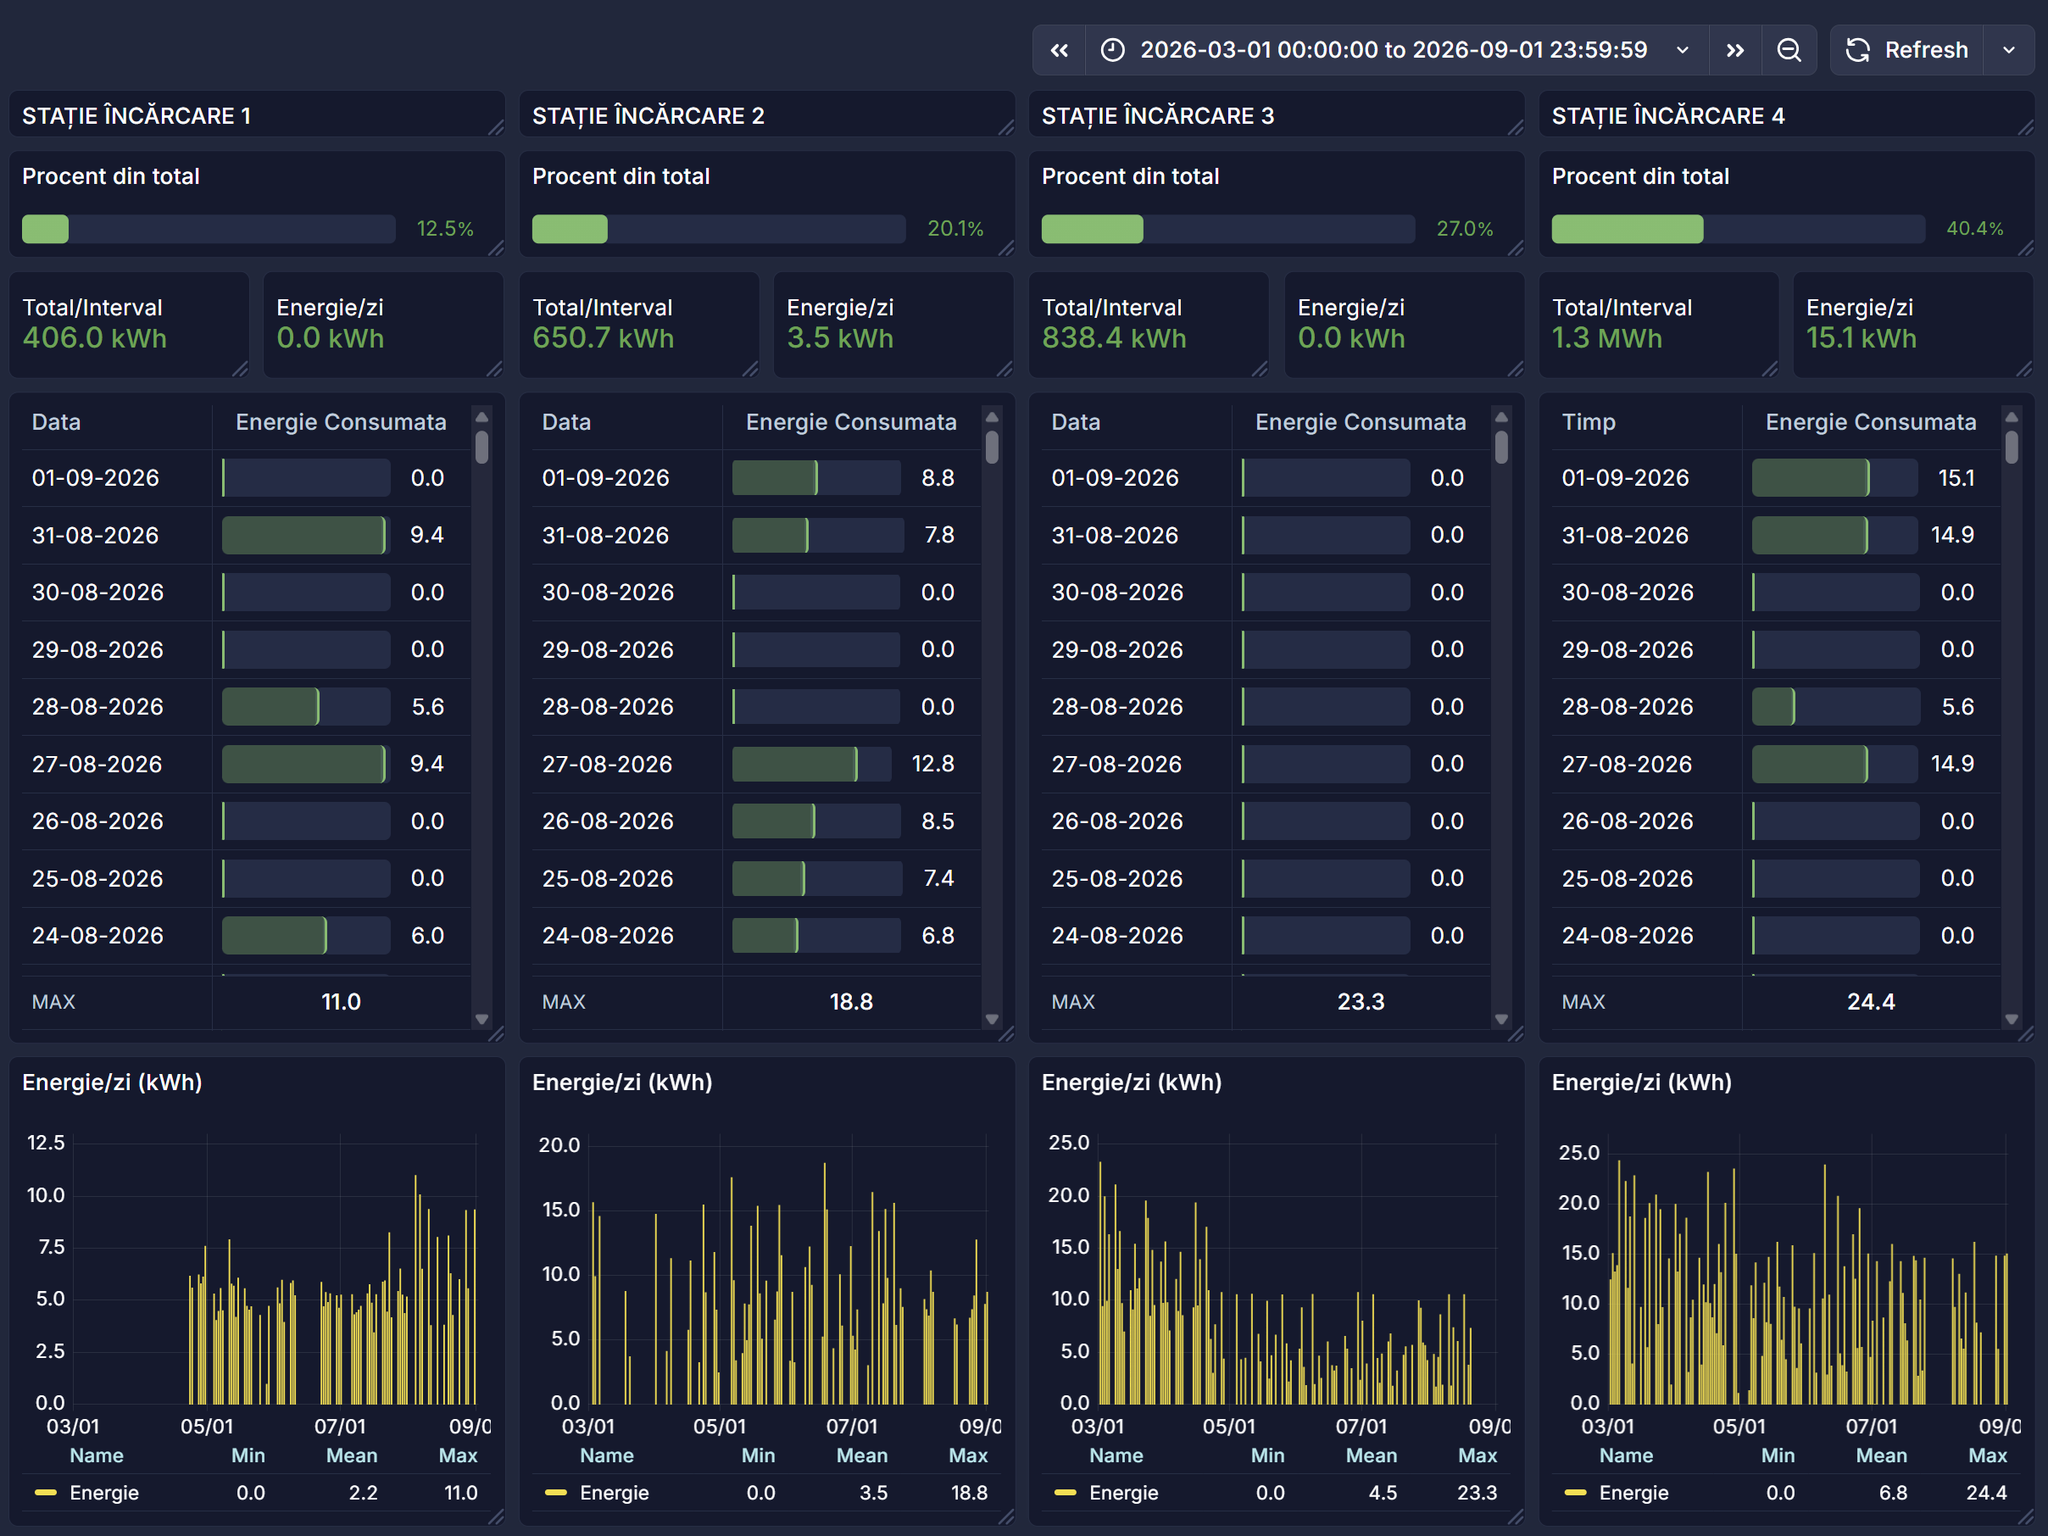
Gas meters broken down by destination (heating vs. production), EV charging stations, UPS systems.
The level of detail: we read the chiller's fault code and the generator's oil pressure, not just pulses from a meter.
What you see in the platform
EFIC+ turns raw data into the indicators used in reporting and performance evaluation.

Normalized indicators: kWh/sqm
Electricity and gas consumption per square meter - a building’s real performance metric, comparable across sites.
Year-on-year comparison
This year’s consumption against the previous one, per energy type and per month. See whether the measures you took had an effect.

Source mix and self-consumption
How much energy comes from PV, from batteries, from the grid. How much of your own production is consumed on site and how much is exported.

Floor-plan heat map
The building’s actual floor plan, colored by each room’s temperature. A screen that is easy to interpret, with no prior training.
Exportable reports
Comparison tables with configurable granularity (day, month, year), exportable to CSV/Excel, feeding your reporting directly.
Alerting and remote control
Configurable thresholds with email notification, plus commands to equipment - for example starting or stopping a generator set from the platform.
Reference implementation: a car distributor headquarters, showroom and service campus
An EFIC+ implementation covering all subsystems: a campus with brand showrooms, workshops, offices, a server room, a PV plant with battery storage, two generator sets, chillers and EV charging stations.
All of these systems - from the PV inverters and storage batteries to the chillers’ fault codes and the generators’ fuel levels - are integrated into a single ecosystem of dashboards, organized into three areas: energy, HVAC and backup power.
Energy
Per-inverter solar generation, battery storage, import/export per transformer, per-circuit metering and year-on-year comparisons in kWh/sqm.
HVAC
Temperatures and humidity per zone with an outdoor reference and ΔT analysis, a floor-plan heat map, and the chillers’ internal parameters.
Backup power
Fully monitored generator sets - from running hours and fuel level to oil pressure - with remote control capability.
The result: a single platform where the facilities team tracks solar generation and self-consumption, consumption broken down by zone, how the cooling plant behaves and the state of the generator sets - with normalized indicators, year-on-year comparisons and exportable reports for internal reporting. The consumption data remains the client’s.
Clients already using the solution
Over 120 monitoring projects implemented for clients with national and local facilities and infrastructure.
How an EFIC+ project works
We handle the integration of every infrastructure component. The client’s team gets the data in one place and can manage the energy budget on real data, not estimates.
1. Initial analysis
An inventory of energy sources and loads, of existing equipment, and of the protocols available.
2. Data and system integration
Integrating data from existing equipment and installing additional meters and sensors where they are missing.
3. Performance objectives
Defining the indicators, alert thresholds and reports the client needs.
4. Deployment and technical support
Platform delivery, team training, and support during and after the warranty period.
Why the energy efficiency transition matters
Energy efficiency delivers significant economic, social and environmental benefits. Beyond cost savings, optimizing consumption reduces greenhouse gas emissions and air pollution, and strengthens energy security. And for companies reporting on sustainability criteria, measured data - not estimated - is becoming a requirement rather than an option.
Frequently asked questions about EFIC+
What software resources are required from the client?
The system is delivered on virtual machine infrastructure, on a server provided by the vendor or the client, or on cloud infrastructure.
How long does EFIC+ integration take?
Generally up to one day of installation per metered site, plus approximately 3-6 days to install and commission the central software package.
Can the solution scale to a national network?
Yes, scalability is one of the main benefits. Sites or systems can be added at any time. We have delivered centralized implementations for clients present in every county, for a national network of 320 locations and for clients with multiple buildings in Bucharest.
Are there project financing options?
Claritech offers the system both with full payment (CAPEX model) and as a monthly subscription (OPEX). We provide financing options and support for EU-funded projects.
Request a personalized discussion
We configure each system according to the particularities of your infrastructure. To discuss how EFIC+ can work for your energy budget, get in touch with our team.